If you are not a LiveAction Maintenance Customer but would like to purchase a Maintenance contract for your LiveAction product please click here for sales information.
Category : Plug-Ins
Submitted By : Victor Wu
Downloaded : 1235 Times
View Comments (5)
WildPackets Cloud Latency Monitor for OmniPeek (CLM) is WildPackets�s latency monitor tool with the intent to assist in monitoring cloud activities.
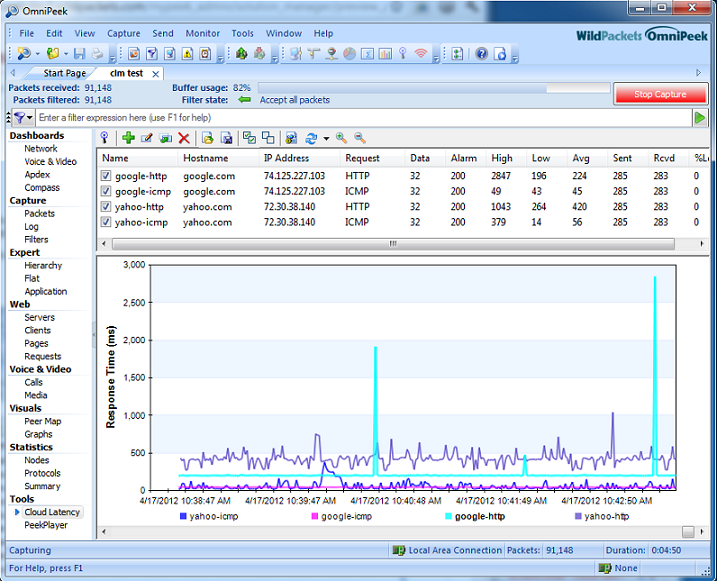
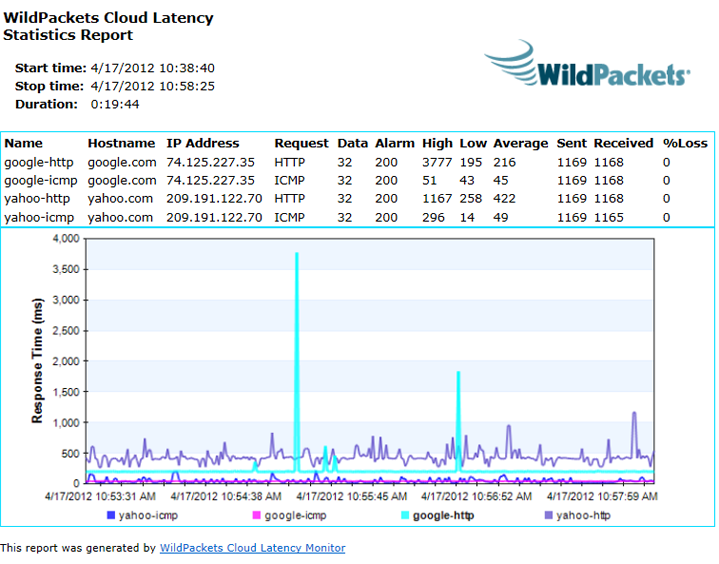
From the following figure, we can compare the latency patterns between google ICMP and HTTP requests. We can also compare google HTTP and Yahoo HTTP requests.
Features:
In this V 2.0 release, the CLM comes with the following features:
1. Real-time monitoring capability for ICMP (ping) and HTTP (GET)
2. User can add/delete filters
3. Ping scan on IP range
4. System Log option
1. User can specify a SysLog server as logging/alarm purpose
5. Latency statistics
1. The following information can be specified by user
1.Filter Name, such as google
2.Target Hostname or IP Address, such as google.com, or 74.125.226.141
1. If a host name is entered, it will be resolved into an IP address
3.The resolved IP address varies from time to time due to the nature of DNS
4.For ICMP request:
1. Data to be sent out with ping
� Can be specified as size of data in bytes between 18 � 1000
� An ICMP socket requires at least 18-byte user data
� Data field of the ICMP packet will be filled with 0x10
2. Or as data string by itself
� Data size should be specified in INTEGER, "99.9" will be treated as raw data
� If data size is less than 18 bytes, the data will be padded with 0x00 at the end
3. Quotation marks can be used to quote a string like "0123", the quotation marks at the two ends will be removed during packing the frame
� This is useful when raw data "10" is desired rather than the buffer size 10.
5. For HTTP request:
1. An HTTP 1.0 GET request will be sent out to the target IP address.
2. Latency is measure as the time between making request and the time the transmission of the whole page is completed.
6. Alarm threshold
1. If the responding latency is larger than the specified threshold, system log/alarm will be provided if SysLog server is specified
2. The following is window-based meaning their calculation is based on window (i.e., collection) size of the samples, default to 1000 samples
1.Highest Latency
2.Lowest Latency
3.Average Latency
4.Loss percentage
3. Sent and Received pings, these are the overall counts
6. Real-time graph on latency (in ms)
1. Should have all active filters in different colors
7. Report (HTML format), including
1. Statistics of all active filters
2. Graph
Usage:
How to use buttons:
This is the toolbar of CLM.

Button 1: START a new monitoring session ( only in standalone version, not available in CLM PlugIn )
Button 2: STOP a monitoring session ( only in standalone version, not available in CLM PlugIn )
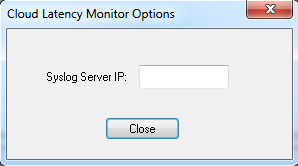
Button 3: SysLog option: user can specify a server which will be noticed when there is a latency greater than what user set.
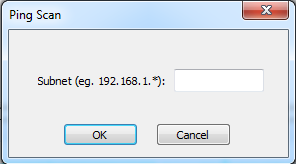
Button 4: Ping Scan: User can specify a subnet range, CLM will scan through the sub network for 20 seconds and add those reachable IPs as new filters.
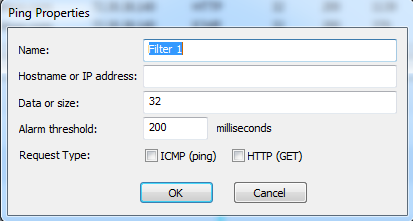
Button 5: Add Filter: user can create new monitoring target by specifying a name, hostname or IP, send buffer or data, and Alarm threshold. User need to specify the request as ICMP or HTTP.
Button 6: edit an existing filter
Button 7: duplicate an existing filter (and give a new name)
Button 8: delete a highlighted filter
Button 9: import pre-defined filters from xml file
Button 10: export filters to xml file
Button 11: select all filters
Button 12: unselect all filters
Button 13: Save Report in HTML format
Button 14: Set the refresh or sampling frequency (1 sec/2secs/3 secs ...)
Button 15: zoom in the graph
Button 16: zoom out the graph
PopUp Menu
Delete All� pop-up menu- Let you delete all the filters at once
v2.0 Limitations
- The time range of the graph will be limited to 86400 points, which is 86400 seconds (24 hours)
- If we reach the point that more 86400 samples are processed, the graph will be reset and start with a brand new session
- Due to the nature of the DNS, a host name may not always map to the same IP address for each new monitoring section
- google.com may be resolved as 74.125.226.136 or 74.125.227.105 or something else
- Currently support HTTP/1.0 GET for HTTP service monitor
History
Version 1.0 03/22/2012
- renamed to Cloud Latency Monitor
- Better graph
- Report capability
Version 1.0.0.7 2/22/2009
- Fixed performance bug
- Added alarms
- Added Delete all
Version 1.0.0.6 2/10/2009
- Added Scan button to toolbar
- Fixed lots of bugs
- Legend works better
Version 1.0.0.3 2/9/2009
- Built-in Graph
- Hi-Def Toolbar
- Interval setting from 1 second to 10 minutes
- Rolling High/Low/Average values in list
- Text or size of data per entry
Version 1.0.0.2 11/21/08
- Works much better now - takes hostname or IP
Version 1.0.0.1 11/03/08
- Release to MyPeek
Comments
We would love to hear some suggestions from other folks out there for useful features. Otherwise we will just make some up.