Slow Network or Slow Server???
Jeff Trawick, WildPackets Professional Services
Since the infancy of computer networks, network folks and server folks have engaged in a nearly constant debate when it comes to the source of slow application performance – is it the server’s fault or the network’s fault? Finger pointing abounds in these skirmishes and often creates real animosity among various IT groups. In fact, the WildPackets Professional Services team has occasionally been summoned to do nothing more than settle such arguments. This is one dispute that OmniPeek is well-suited to settle. Let’s take a look at a couple of TCP conversations, and you’ll get the idea…
In both of these conversations, the packets were captured at a point very near the server, so the perception of time between packets is approximately the same as that seen by the server. These conversations were isolated using OmniPeek’s Visual Expert.
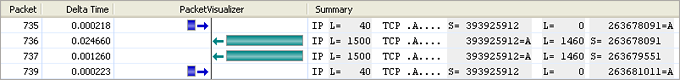
In this first conversation, notice that the delta time from the client’s request (packet 735) to the server’s data transmission in packet 736 is only about 24 milliseconds. That’s an awesome response time! But remember, this trace was collected on the server side of the network. If the client is still seeing slow responses, we can definitely say that the server is not at fault! If we were to perform a capture with OmniPeek close to the client, we might see a different story in these delta times that would indicate slowdowns between the server and the client. That’s right, network guys! In this case, long response times at the client side would point to excessive latency on the network since we’ve definitely demonstrated that the server answers the client very quickly. Further investigation would be needed to determine the source(s) of the delay.
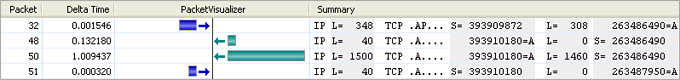
Now before you server guys get too excited about the network’s faults shown above, take a look at the opposite extreme! In the following capture, notice that the server does not immediately send data in response to the client’s request (packet 32). Just over 132 milliseconds later, the server sends packet 48, which is only a TCP ACK for the client request. We know it’s just an ACK since its data length is zero (L = 0 in the Summary column for packet 48). Then, after an additional wait of over 1 second, the server finally sends data to the client. Since we are capturing next to the server, the delay can’t be caused by the network. You should also recognize the fact that the client responds to the server in a speedy 0.3 ms (packet 51), which also shows that the network is capable of quickly moving a packet between these two devices. So, in this instance, the server is to blame. We would need to examine the operations of the server and its applications to determine the root cause of the delay.
As a side note, some of you may look at this and say, “Hey, what’s the big deal – it’s only one second!” True, but this is only one transaction. Imagine the total impact if the server performed this slowly throughout a long conversation consisting of hundreds, or even thousands, of these transactions!!!
One of the key elements of this analysis is the location of your OmniPeek analyzer. All of the times reported by OmniPeek are affected by its position on the network relative to the devices being monitored. For this analysis, the most logical location is near the server since we are trying to identify the latency’s origin, and since the debate focuses on network vs. server.
This is just one example of how OmniPeek can point its own fingers at culprits when it comes to performance. Sometimes the network loses; sometimes the server or application loses. Whatever the case, packets never lie! As long as we deploy and use OmniPeek properly, it will always be able to reveal the slowpoke!