Graph It Up!
Jim Thor, WildPackets Professional Services
Documentation! Reports! Paperwork, Paperwork, Paperwork! Enough already. Your boss keeps asking for them, but you don’t even have time to do your primary job, and they want reports of the network. And what do they want in the reports? Pictures, not words! Graphs!
Well, in this tip, we are going to make it simple. Bottom line, let OmniPeek do it for you and save you the effort. We are going to focus on WLAN Graphs in this tip, but the same approach could be used in other areas and tabs as well.
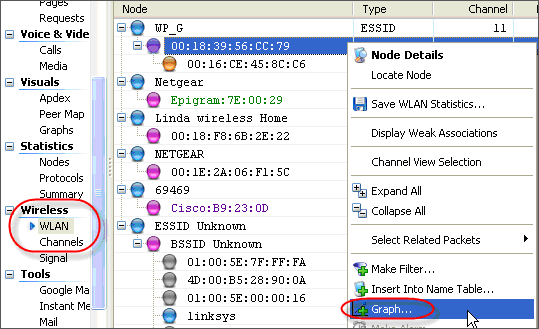
First step, remember to ‘Right-Click’. Today, we will do it from the WLAN Tab, and select ‘Graph’.
 |
|
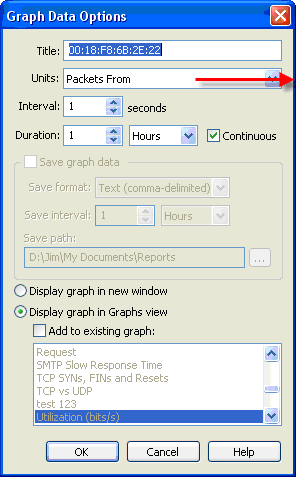
The nice part about WLAN graphs, is the multitude of options you get to graph on. |
|
 |
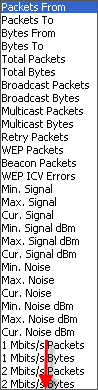 |
And the speed options go on and on…And, since you can add multiple items to a single graph, you can now have comparison graphs for your WLAN so your boss will have what he needs. |
|
 |
|
And remember, if you use ‘Statistics Output’ in a capture to automate the process of creating the reports, all the custom graphs you create will be included automatically.
Some suggestions of graphs you ask? There are many, but how about…
CRC errors vs. Retries for a particular node or AP
Signal strength for a particular node, or nodes
Ongoing SNR
And on and on…
Keep in mind also, that in the Channels tab, you can graph a lot of these items including for traffic on a particular channel if necessary.
So, there you have it. Set it up once and forget it.
If you found this tip helpful, you may want to go check out all the other ToTMs at http://www.wildpackets.com/support/additional_resources/tip_month