Increasing Your APP-titude
Jeff Trawick, WildPackets Professional Services
Application performance – are they simple words, or are they really your two-word job description? Whether you write software, maintain servers, or manage the network infrastructure, application performance is really the bottom line of your professional existence! If the applications don’t work so that users can be productive, then you’re in the doghouse!
There are gazillions of tools on the market that allow you to track various aspects of application performance. These tools usually offer a huge arrays of performance metrics, but sometimes it’s hard to see the forest for the trees – you get so overwhelmed by the sheer volume of statistical reports that it’s difficult to see the big picture. In this case, the big picture is simple: Are your applications behaving in a way that satisfies your users? Unfortunately, many IT folks don’t really know the answer to this question; their application aptitude is low! If you’re in this situation, take heart! OmniPeek has everything you need to increase your APP-titude!
In past Tips, we’ve highlighted the Application Performance Index (Apdex) features of OmniPeek. As a reminder, Apdex measures application response times and produces a single score that tells you how well or how poorly each application performs. Apdex classifies application performance by three levels of user satisfaction: satisfied, tolerating, and frustrated.
It’s one thing to see this reported in the Expert as a column of numerical data, but using OmniPeek’s great graphing capability allows you to visually summarize declines in application performance. Just go to the Summary Statistics view and graph the occurrence the Apdex Tolerating User and Frustrated User events. You might even want to build a graph to compare these events to network utilization, slow server response times, or other application vital signs. Take a look at the example we’ve built below:
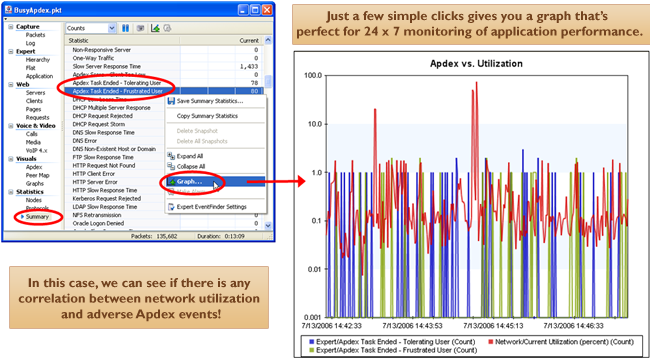
Don’t forget that this graph can be used during real-time captures so you have a constant picture of how your applications are really behaving. Want to focus on just one or two applications? Build a filter for the app and apply it in real-time. The graph will instantly change to reflect only the application(s) you’ve selected. It’s real-time! It’s 24 x 7! It’s one small step in OmniPeek, but one giant leap toward improving your APP-titude!